Monitoring
Dashboard
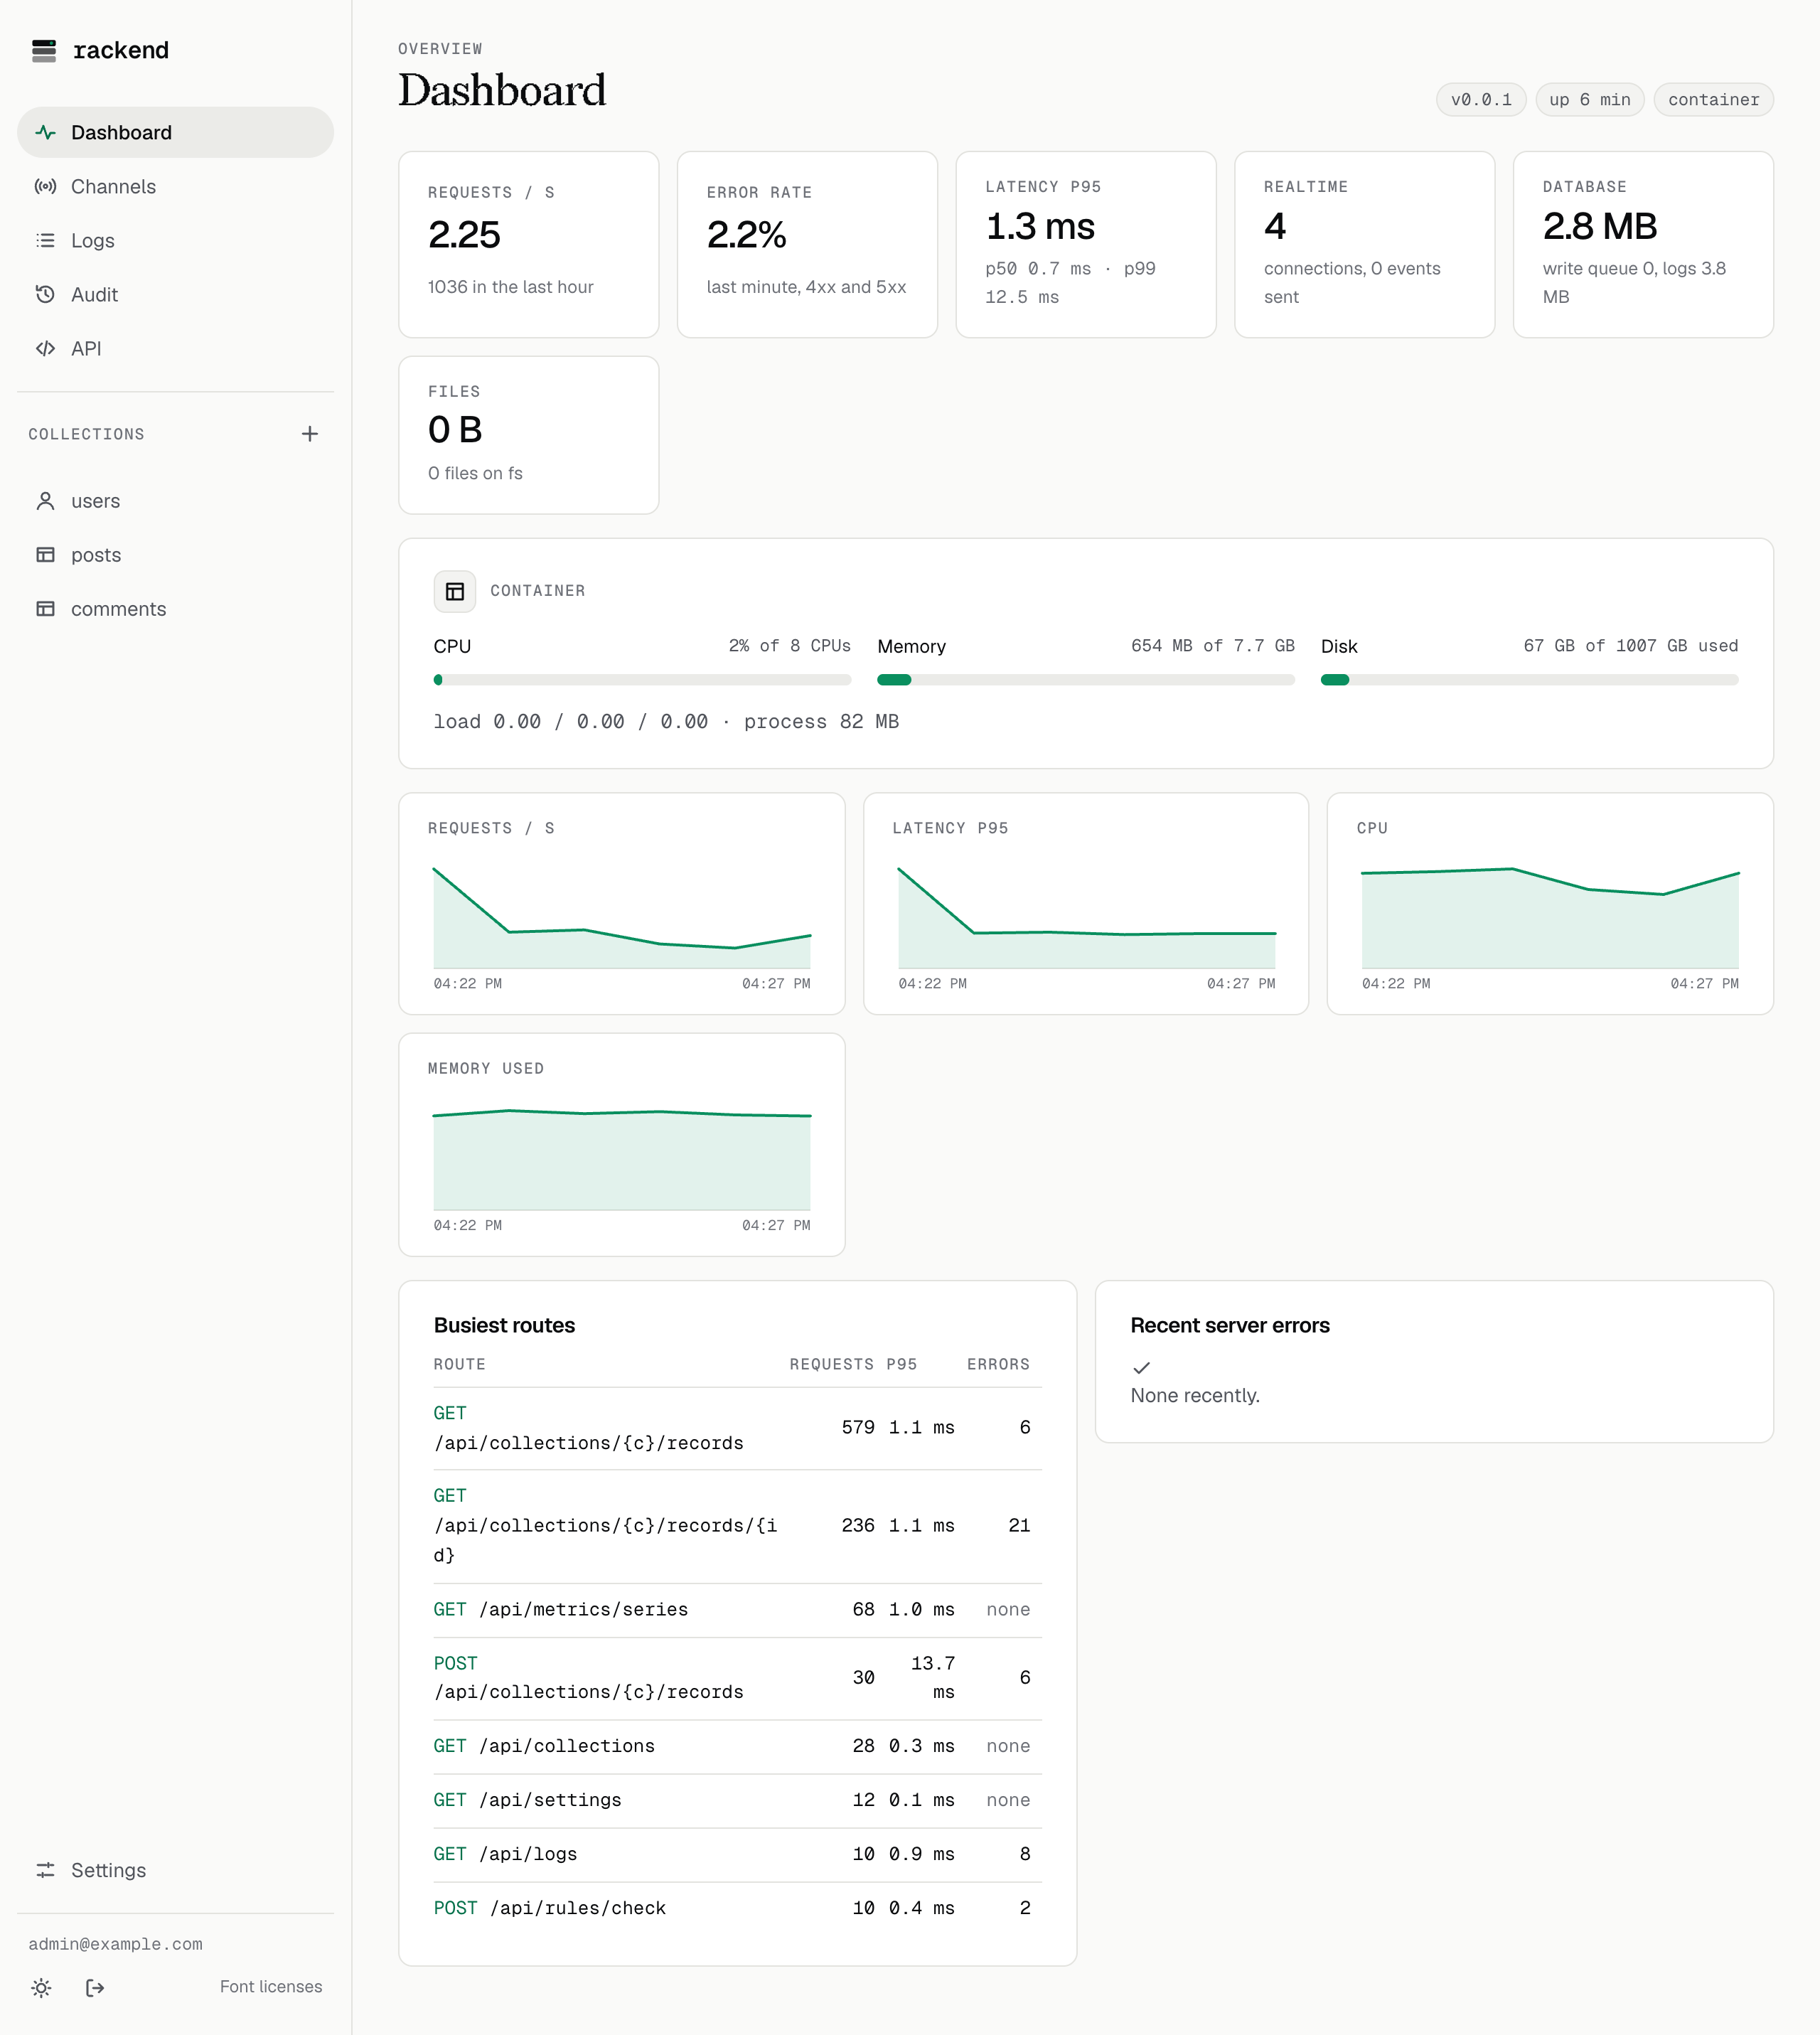
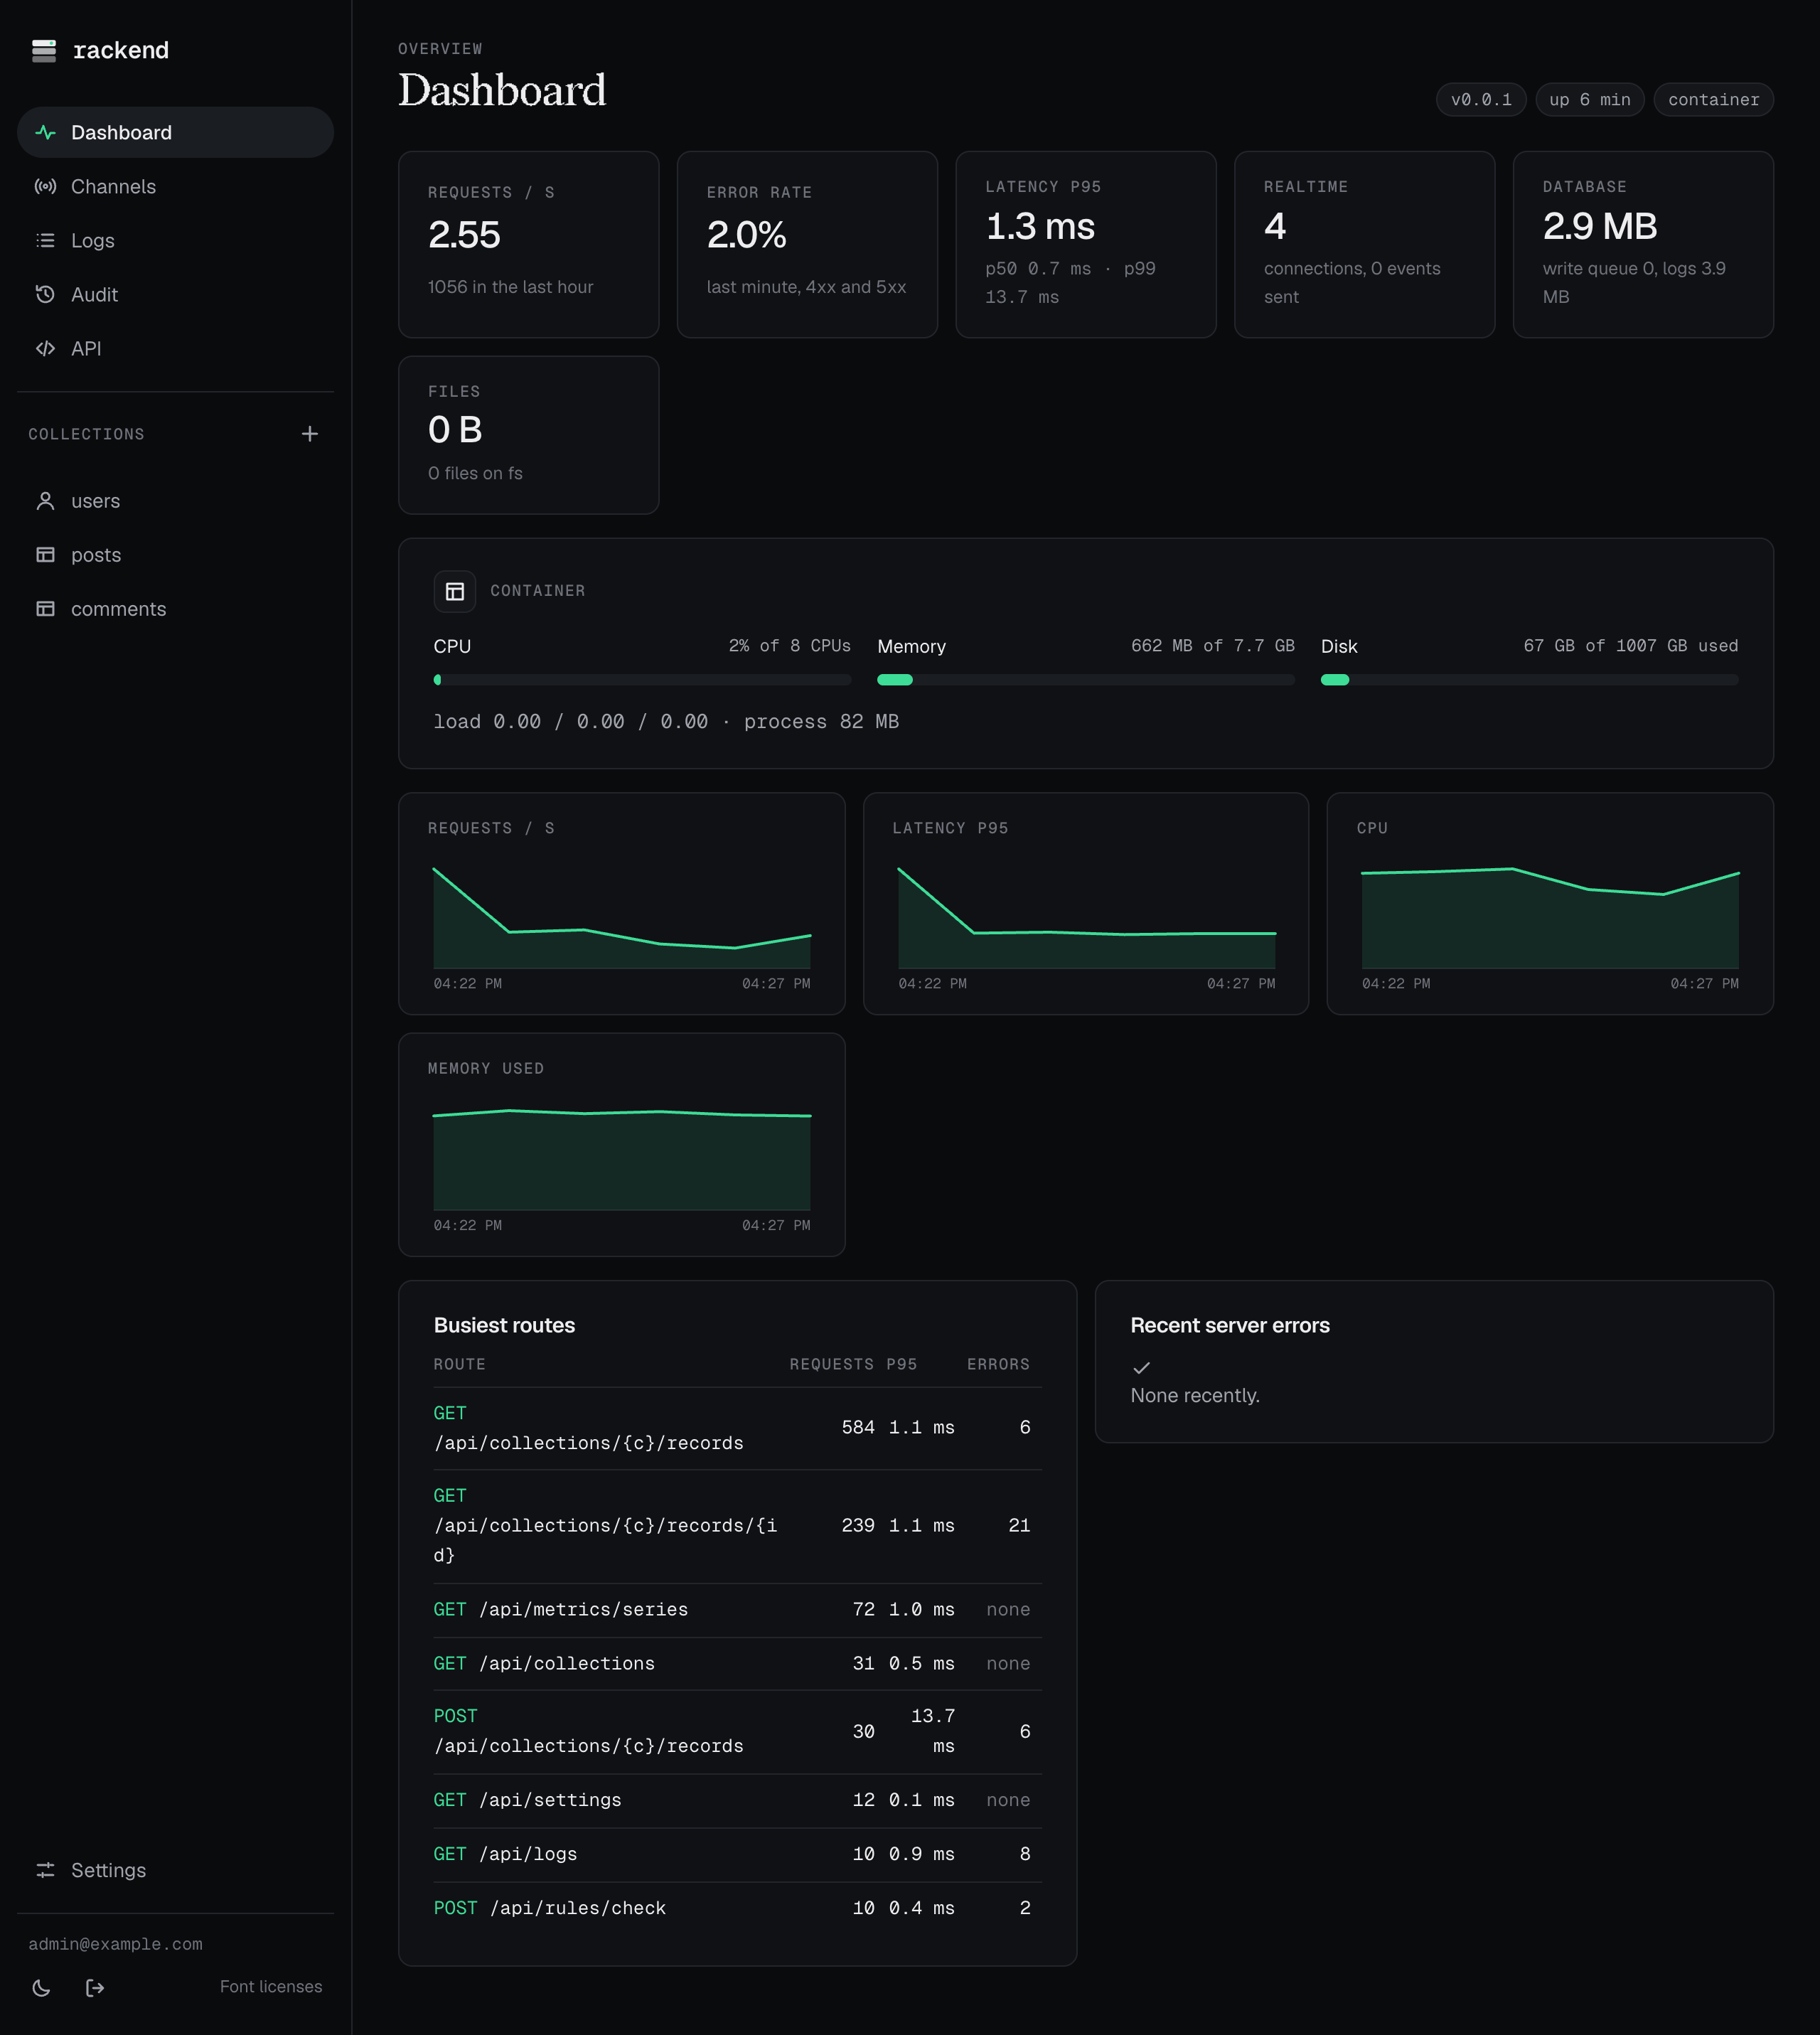
Section titled “Dashboard”The admin UI shows requests, errors, latency, the busiest routes, recent server errors, database and file sizes, realtime connections, and CPU, memory and disk. Inside a container with memory or CPU limits it shows the container’s limits, not the host’s. It warns when the data directory’s disk has less than 10% free.
Request logs
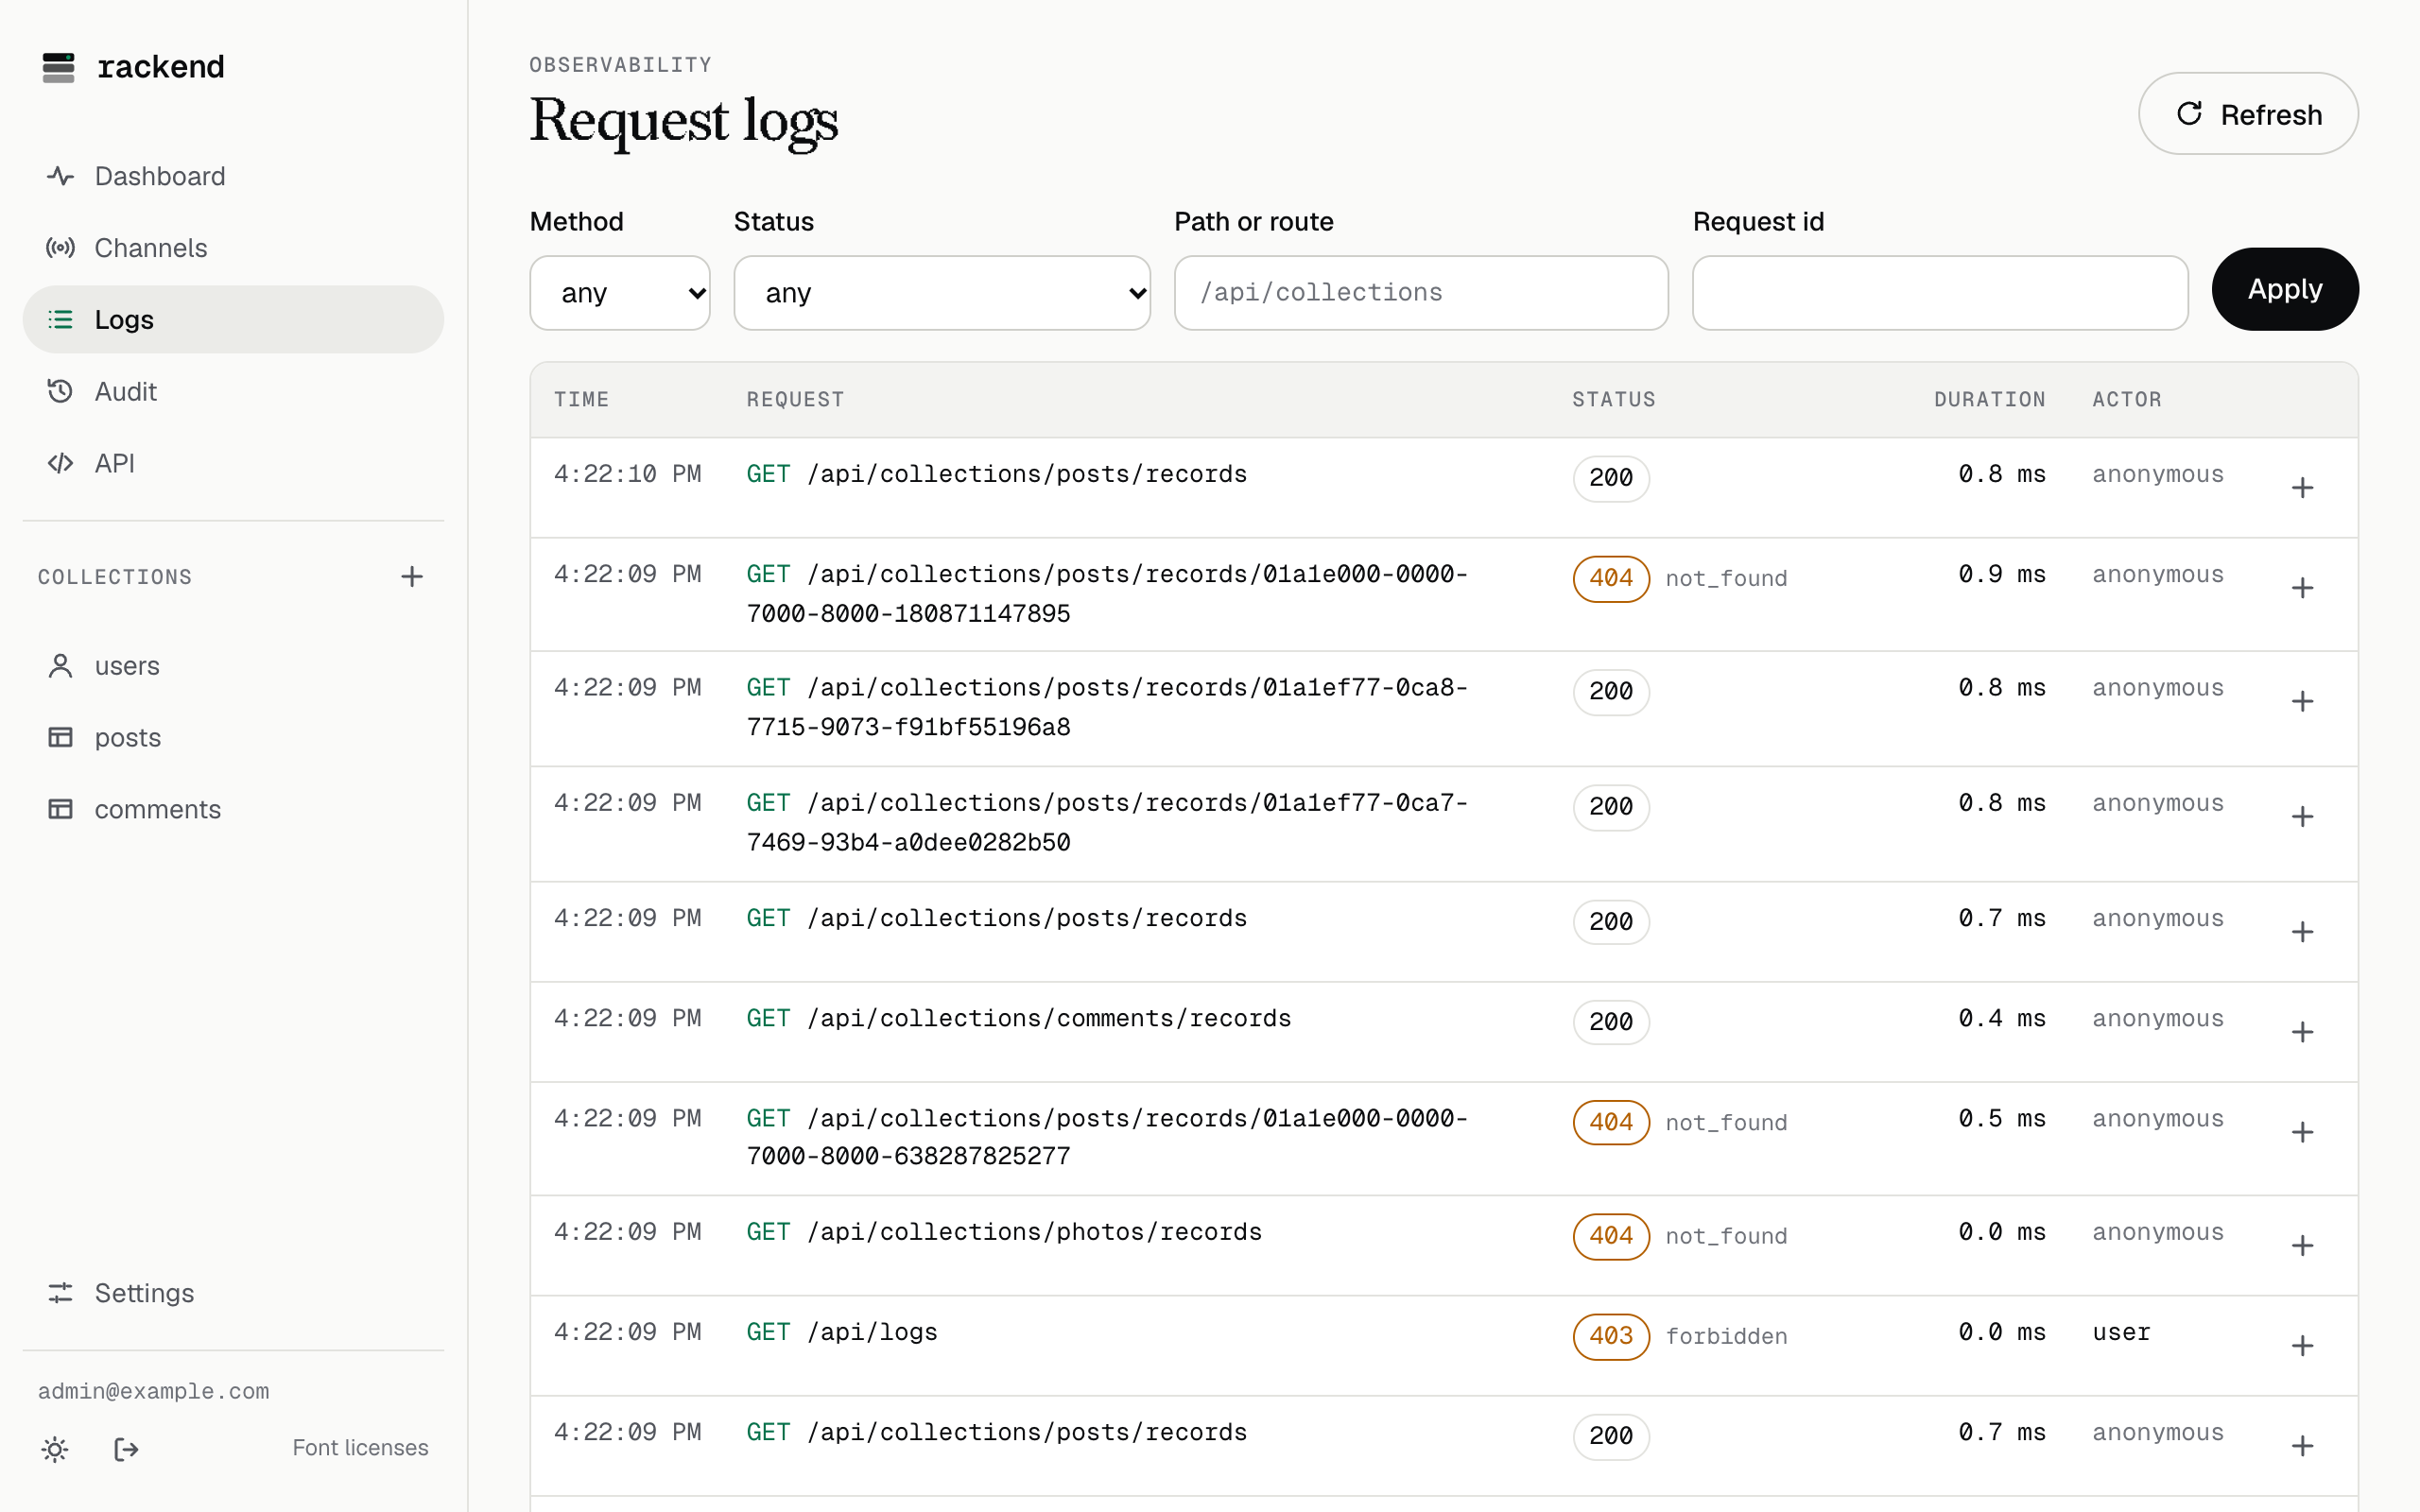
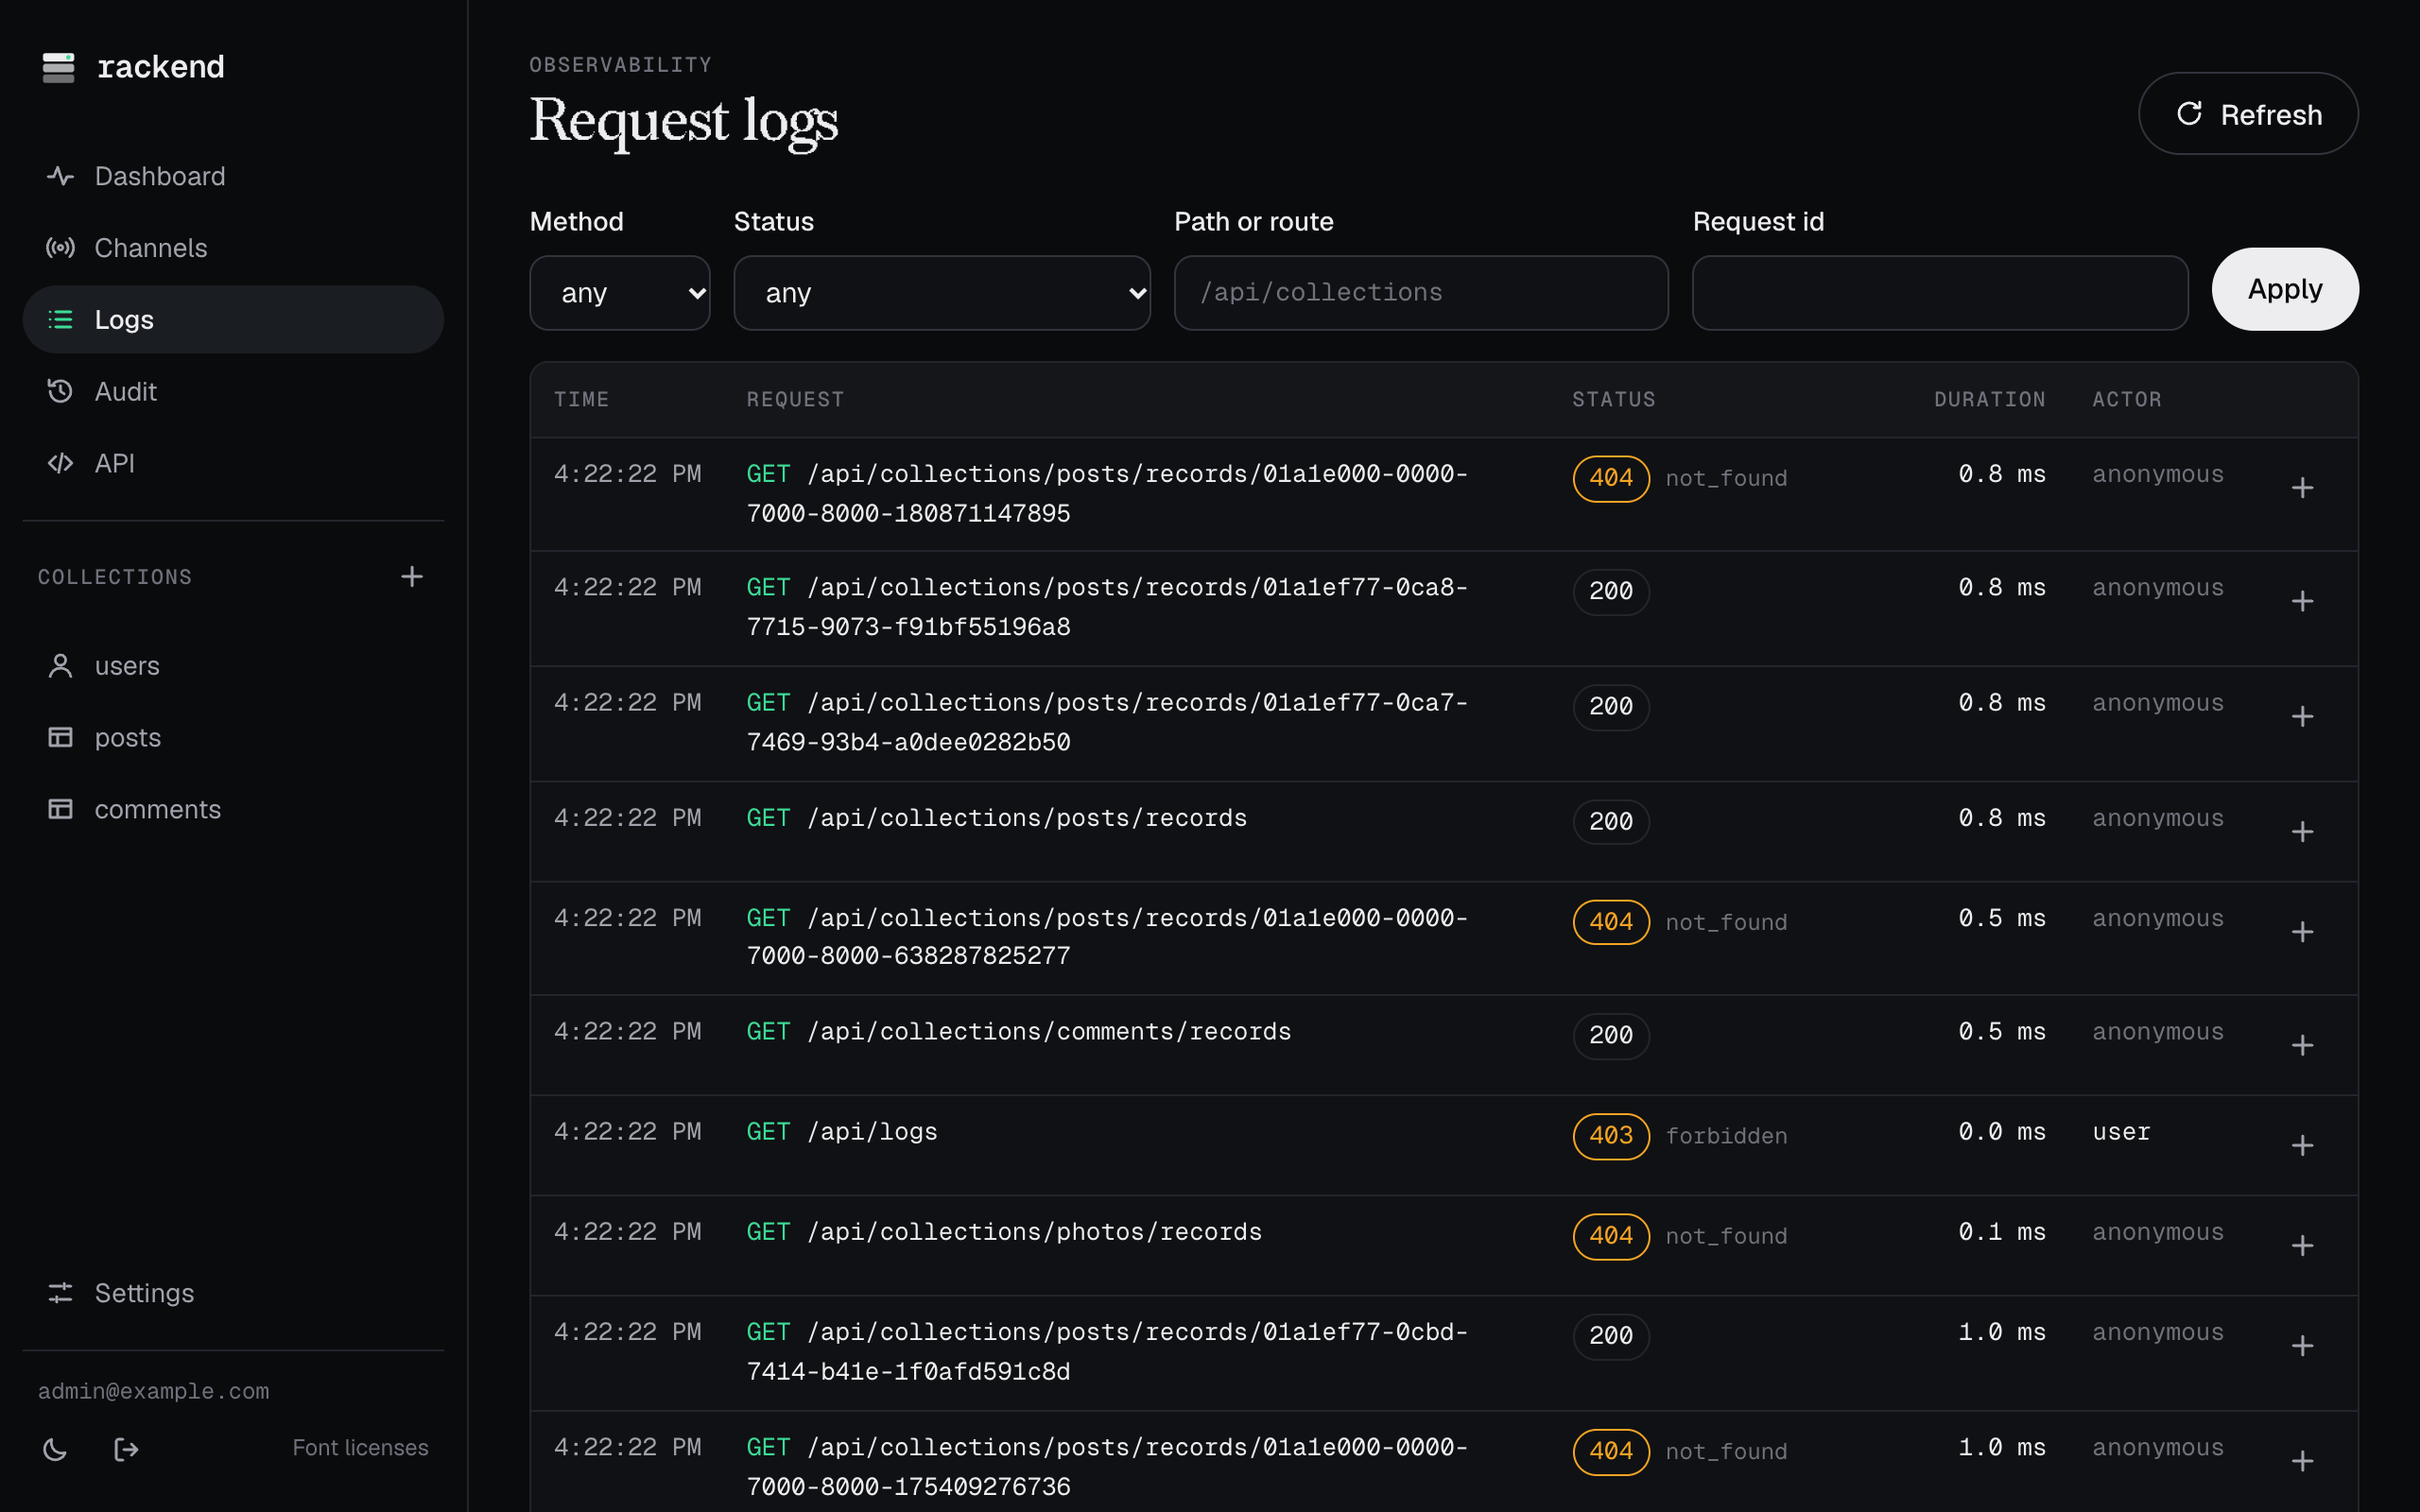
Section titled “Request logs”Every request except health checks and admin UI assets goes to logs.db, kept for logs.retention_days (default 7). logs.min_status keeps only errors, logs.sample_rate samples successful requests. Losing logs.db loses no data.
Audit log
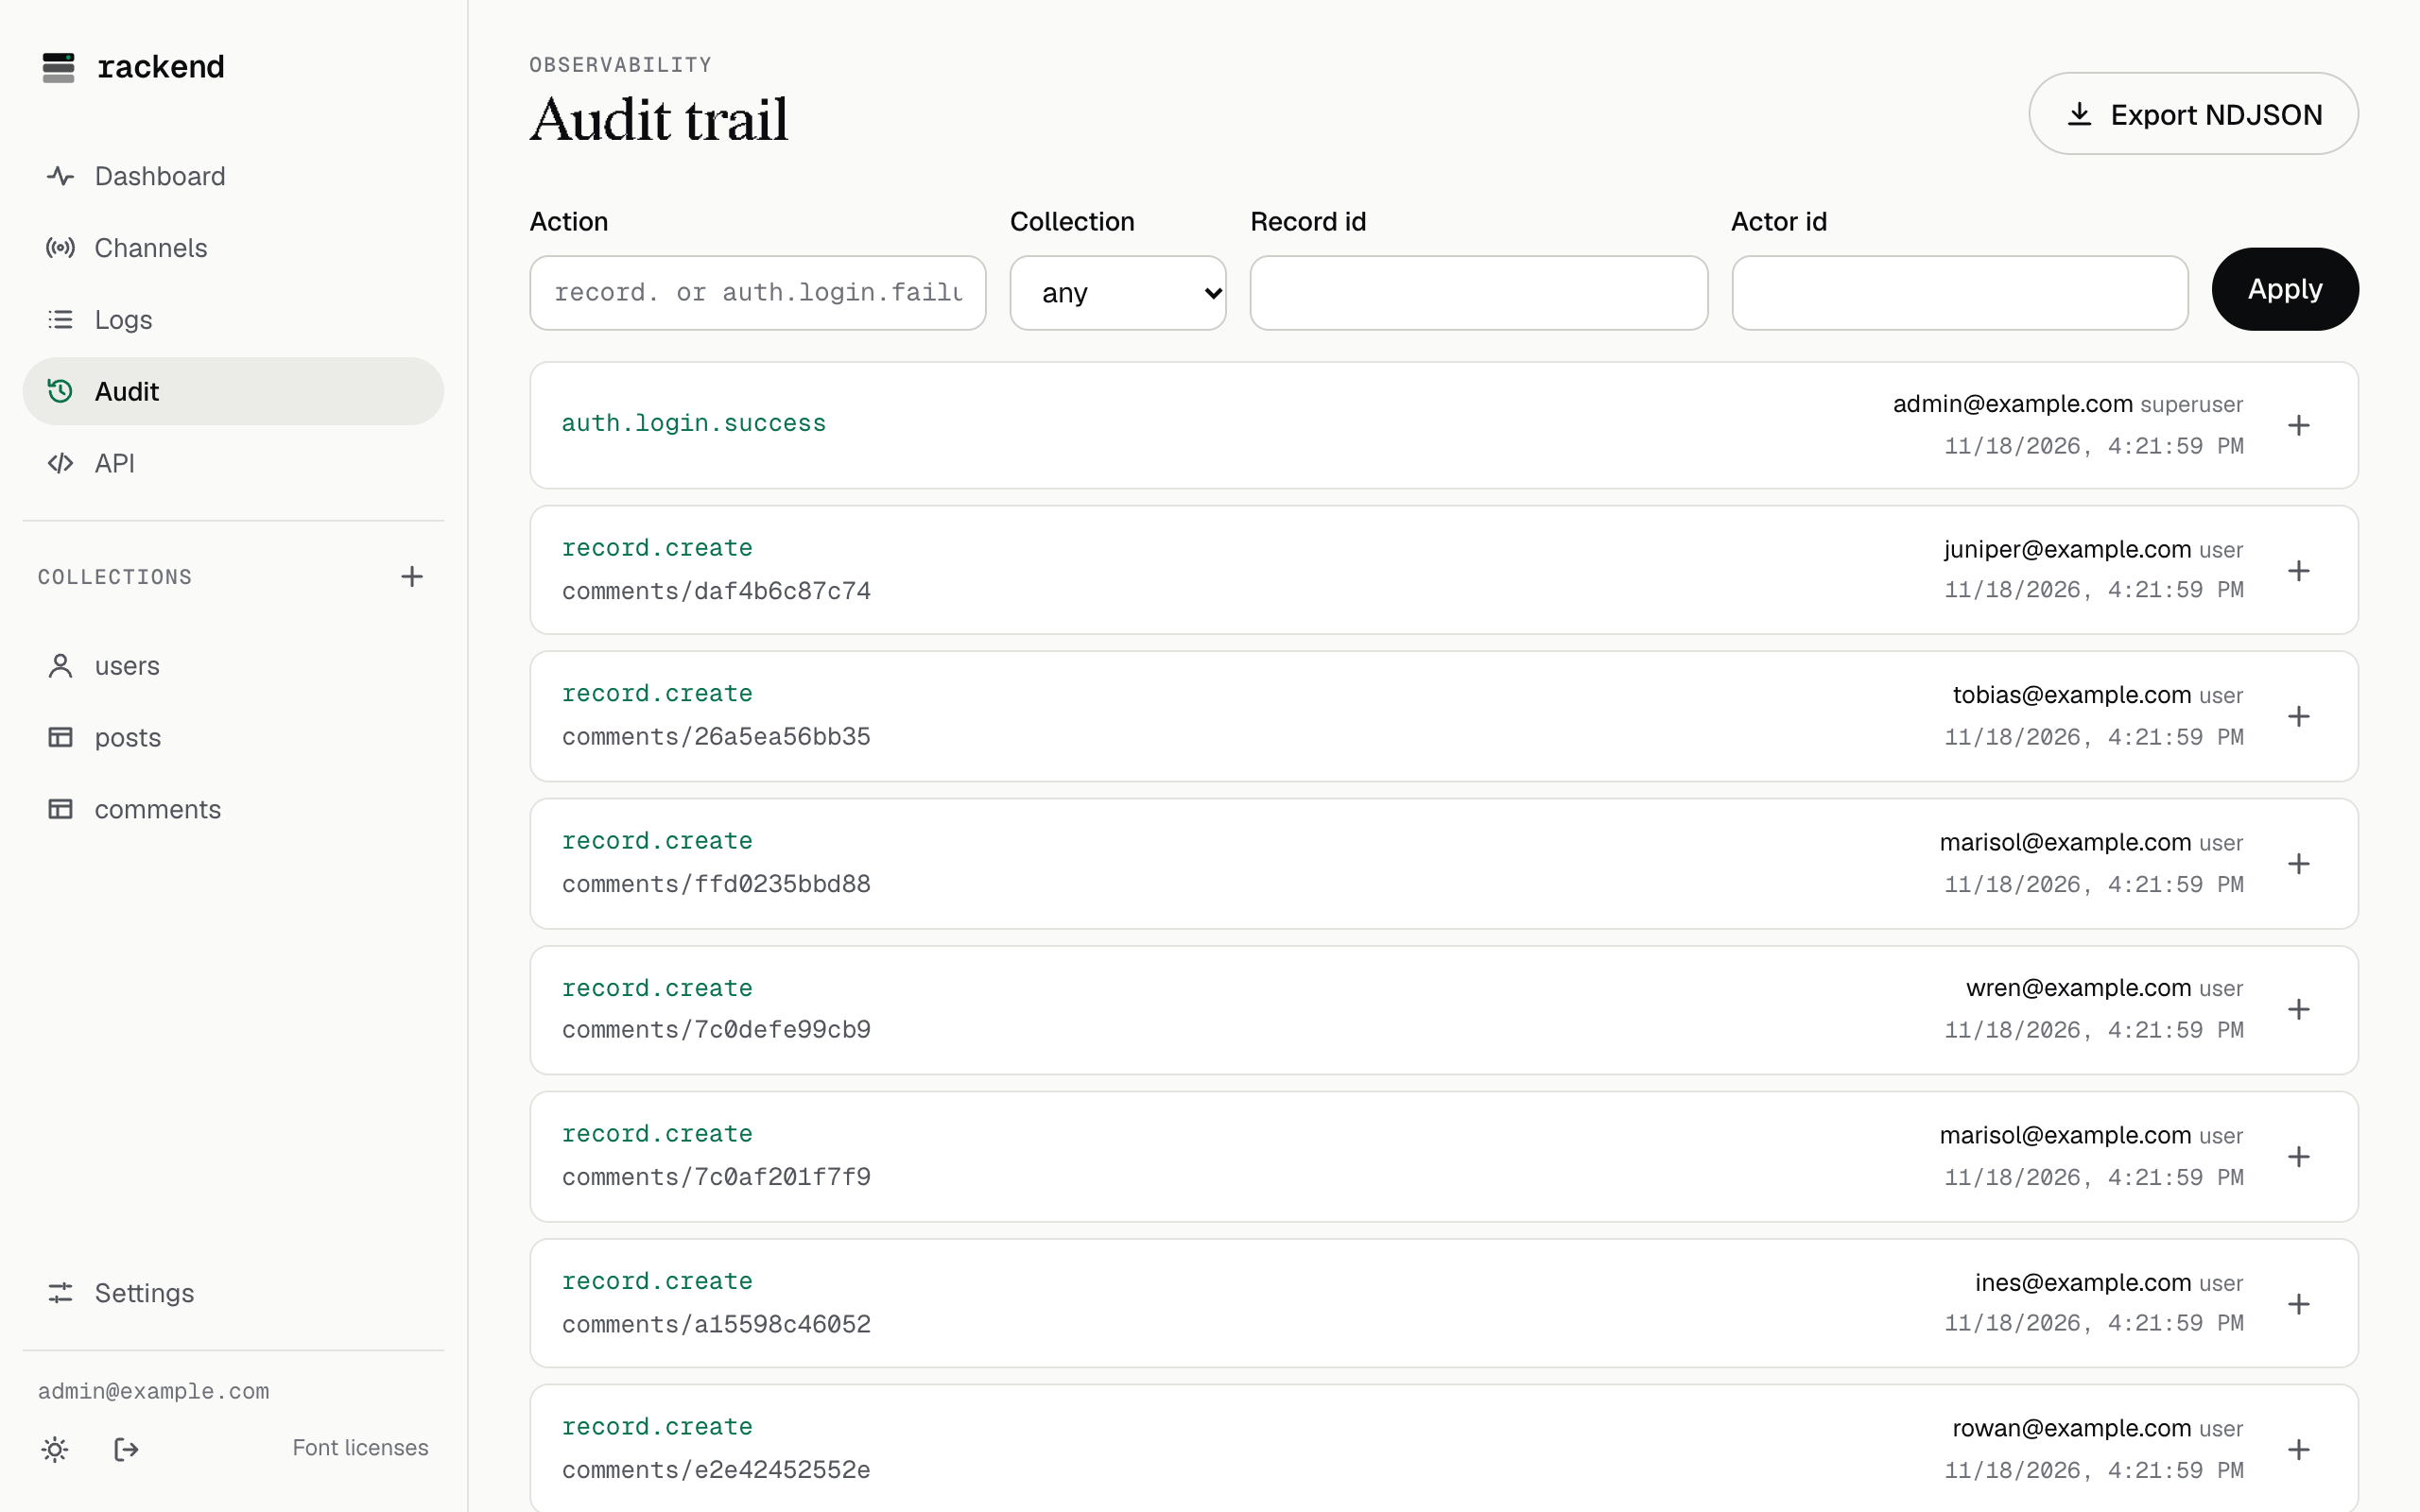
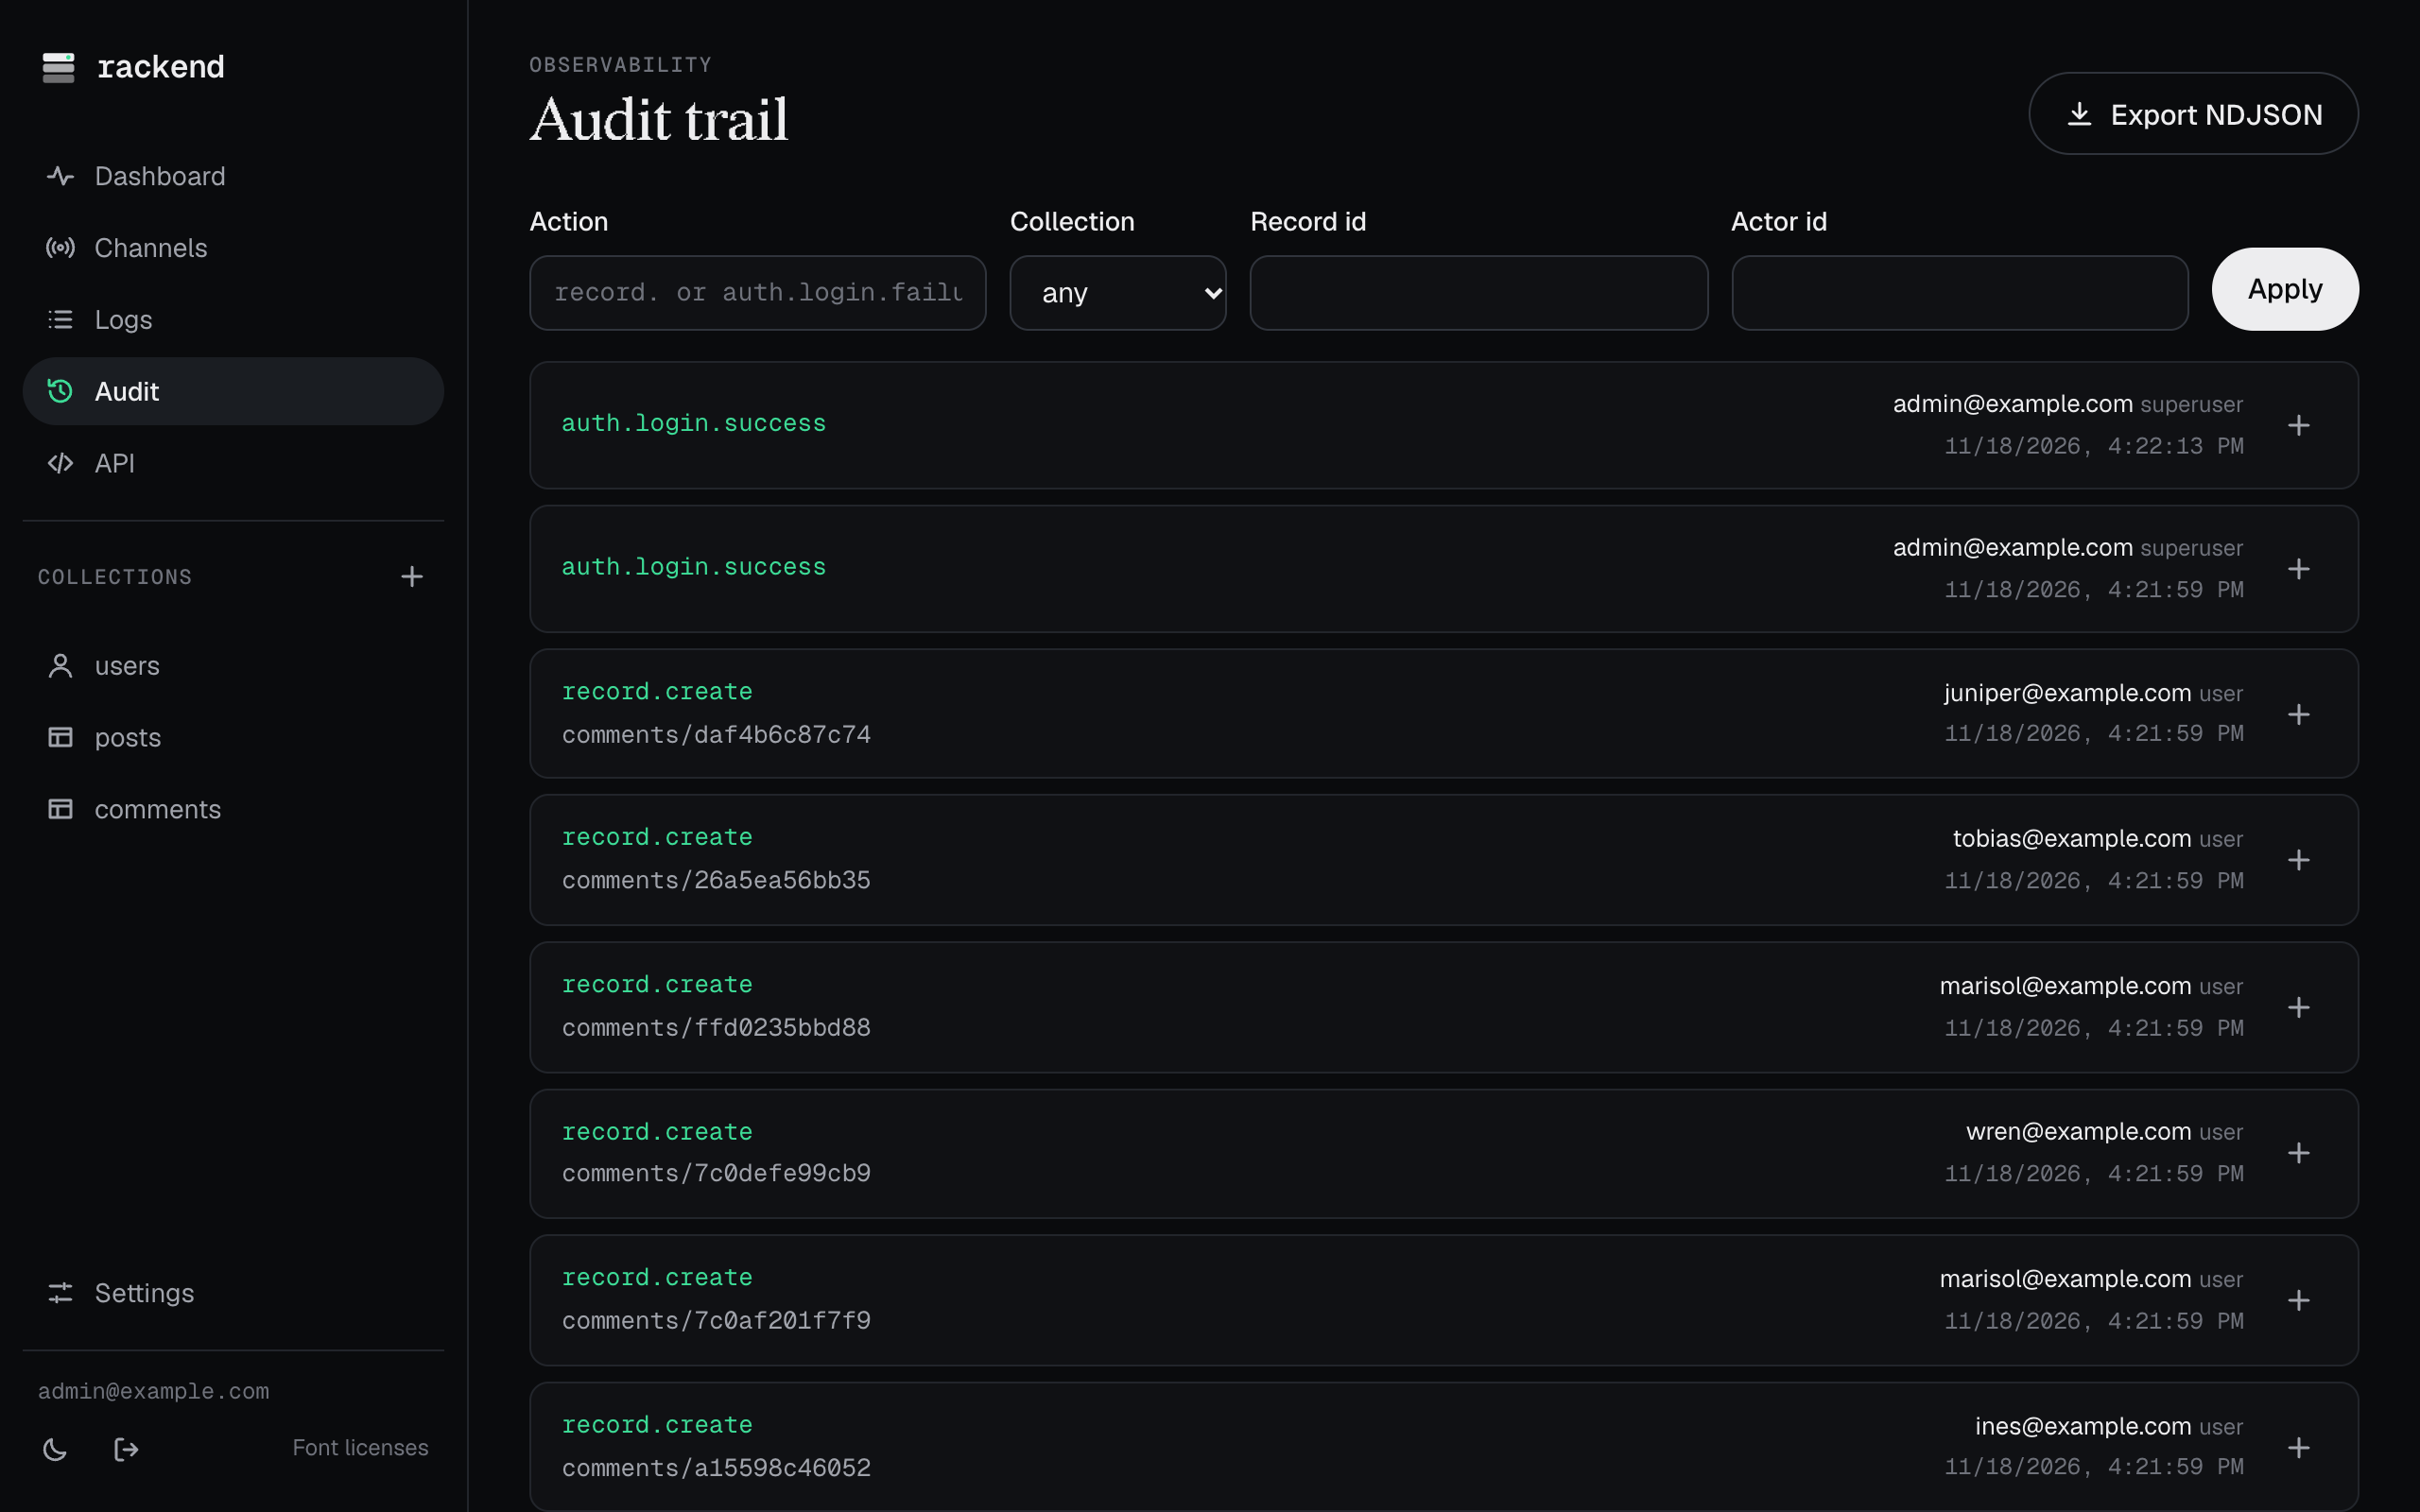
Section titled “Audit log”The audit log (Audit in the admin UI) records, among others, sign-ins and sign-in failures, password and email changes, revoked sessions, changes to settings, superusers, channels and backups, and the encryption events secrets.rekey and secrets.reset.
Prometheus
Section titled “Prometheus”GET /metrics is off until you set metrics.prometheus_token in the settings (send it as Authorization: Bearer <token>) or metrics.prometheus_public: true.
OpenTelemetry
Section titled “OpenTelemetry”Set RACKEND_OTLP_ENDPOINT to export traces (one span per request with database spans below it) and metrics over OTLP/HTTP.
rackend logs JSON lines to stdout; every line inside a request carries its request_id, also returned as the X-Request-Id header.